
A dynamic general equilibrium model of the California economy.
The BEAR model traces a policy through the whole economy instead of costing it in isolation: which sectors contract, which expand, and what happens to employment, household income and state revenue, year by year. State documents cite it as the Berkeley Energy and Resources (BEAR) model; the Department of Finance has described SRIA results as estimated using the BEAR forecasting model.
Compliance cost is the start of the analysis, not the end
Direct-cost accounting answers one question: what does this rule bill to the regulated party? On its own that number overstates some regulations and understates others, because it stops at the first transaction.
Money spent on compliance is paid to somebody: equipment makers, installers, auditors, insurers. Those industries hire. The regulated sector may raise prices, shed jobs or move activity, and households at different incomes absorb the result differently. A general equilibrium model tracks all of that at once and requires the accounts to balance, so every dollar has a source and a destination.
The question is never only what a rule costs. It is what the state looks like in year ten, with the rule and without it.
- By sector. Interlinked production sectors, each with its own cost structure and substitution possibilities, so a rule aimed at one industry shows up in its suppliers and customers.
- By household income group. Results reported across income groups, which is what makes distributional and disadvantaged-community findings possible.
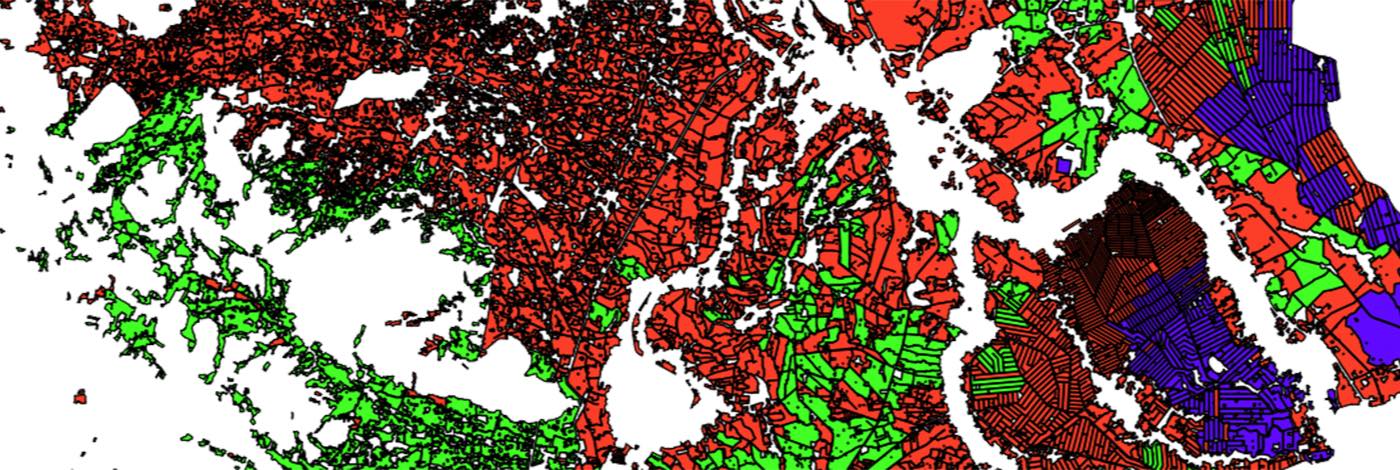
- By place. Statewide results are carried to counties through county social accounting matrices (built at 60 and 195 sectors for the California ISO study) and on to census tracts.
- Over time. Dynamic, not a single-year snapshot: capital accumulates, adoption phases in, and compliance schedules run as they actually occur.
One picture of the California economy, the state’s own
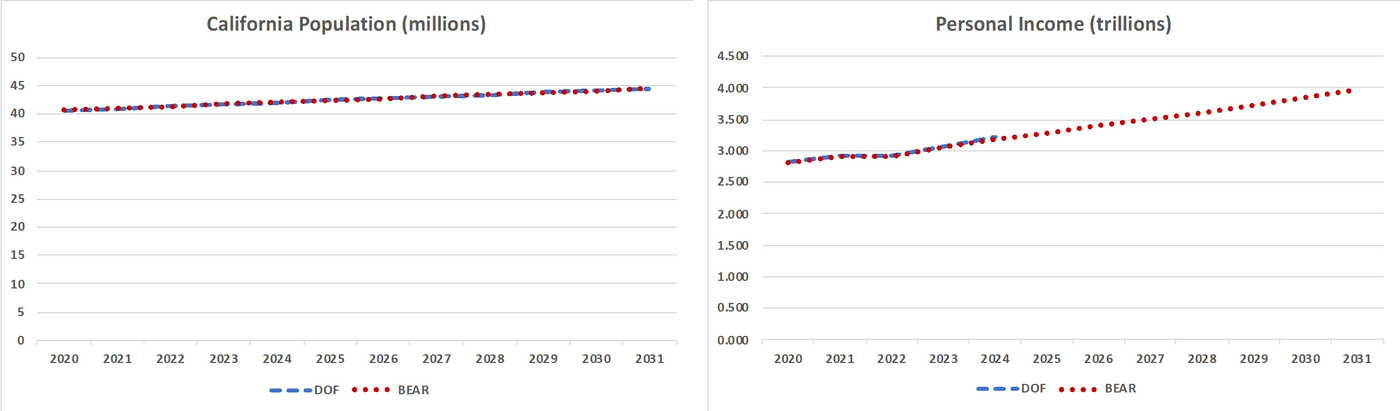
Department of Finance reviewers compare every SRIA against the state’s official outlook. BEAR’s baseline is calibrated to it: population is taken from DOF projections as an input, and personal income and employment are calibrated to the DOF series. The baseline was most recently recalibrated to the April 2025 projections.
So a reviewing analyst compares one picture of the economy with itself instead of reconciling two.
The 2017 model comparison
For the California Energy Commission’s SRIA program, the team ran the same appliance efficiency rule through REMI PI+, IMPLAN, RIMS II and the BEAR model, and compared the REMI and BEAR baselines for 2015 to 2030. The report is public.
IMPLAN and REMI report at county level. BEAR’s tract-level downscaling is what lets a SRIA or a closure study say which communities carry the effect.
Read the model comparison (PDF)Where the state has used it
- 2006Macroeconomic analysis of the state’s climate strategies for the Climate Action Team (CalEPA), and an economic assessment of the Global Warming Solutions Act (AB 32).
- 2007For the Air Resources Board, an independent assessment of three ARB reference scenarios using the BEAR model.
- 2016 to 2018The California Energy Commission’s SRIA program: the 2016 appliance efficiency SRIA, guidance for the Commission’s SRIAs, a review of SRIAs to date, the SRIA baseline forecast, and the model comparison.
- 2016Economic and disadvantaged-community volumes of the California ISO’s SB 350 regional grid study, with results by census tract.
- 2018Long-term energy scenarios for the Energy Commission, with employment forecasts to 2050 for about 8,000 census tracts (CEC-500-2018-013).
- 2019 to 2024SRIAs for DOJ, DIR / Cal-OSHA, CHP, CalGEM and the California Privacy Protection Agency.
- 2024A Los Angeles model of 23 sectors and 22 occupations, with workers placed by council district, for the City’s hotel and airport worker study.
- 2025Baseline recalibrated to the Department of Finance’s April 2025 projections.
- 2026The California ISO’s AB 825 California Jobs Study, forecasting electric power jobs to 2040.
Request a model briefing
For agency economists and review staff: a working session on the baseline, sector and regional detail, and how results are documented for Department of Finance review.